

Demand sensing is a short-term forecasting method that updates the demand forecast for the next few days to a few weeks from the latest signals, such as point-of-sale (POS) data, inventory movements, orders, prices, promotions and weather, so that replenishment, allocation and production follow what customers are buying now.
The longer-range demand plan still sets the baseline, and demand sensing corrects the near end of it as new data arrives, usually every day. The correction is worth something only when it changes a decision, such as a store order, a truck allocation or the next production run.
What Is Demand Sensing?
The concept of demand sensing is that recent signals, such as yesterday’s POS data and this week’s weather forecast, are leading indicators: they carry information about next week’s demand that the sales history doesn’t contain yet. A conventional statistical forecast learns patterns from history and is rebuilt in a weekly or monthly cycle. Demand sensing keeps that forecast and corrects its first days or weeks with those signals, giving recent data more weight the closer the date.
Every demand sensing setup has a horizon and a grain. The horizon is how far ahead it looks, usually matched to the lead time of the decision it feeds. The grain is the level it forecasts at: typically SKU by location by day, and within the day for fresh food that arrives more than once a day.
What Are Demand Signals?
A demand signal is any data that tells you what customers will buy before the sale shows up in your own order or shipment history. POS scans, retailer stock levels, web traffic and a heatwave forecast are all demand signals.
A CPG manufacturer has to separate sell-in from sell-through. Sell-in is what retailers and distributors order from you; sell-through (also called sell-out) is what consumers buy from them. Orders arrive later than consumer demand and in bigger, lumpier batches, which is how a small change at the shelf becomes a large swing at the factory (the bullwhip effect). Demand signal management is the work of collecting and cleaning these feeds, often in a demand signal repository. Demand sensing is what turns them into a forecast.
Demand Sensing vs Demand Forecasting vs Demand Planning
Demand forecasting is the calculation, and demand planning and demand sensing are two uses of it. Demand planning produces the consensus forecast for the coming months that drives budgets, capacity and S&OP. Demand sensing takes the first days or weeks of that forecast and corrects them from recent signals, at a finer grain and a faster cadence.
| Demand planning | Demand sensing | |
|---|---|---|
| Question it answers | How much will we sell over the coming months? | What will sell in the next days or weeks, given what happened yesterday? |
| Horizon | Months to a year or more | Days to a few weeks |
| Grain | Product family, region, week or month | SKU, location and day; within the day for fresh |
| Update cadence | Weekly or monthly cycle | Daily, or as signals arrive |
| Main inputs | Sales history, seasonality, commercial plans | POS, stock, orders, prices, promotions, weather, web traffic |
| Decisions it feeds | Capacity, budgets, supplier contracts, S&OP | Store and DC orders, allocations, deployment, production sequence |
| Weakness on its own | Can’t react to a heatwave or a promotion that flops | Swings with noise and has no long-range anchor |
Demand shaping is a separate idea. It changes demand with price, promotion and placement instead of predicting it. Solvoyo’s demand planning covers sensing and shaping on one platform, and sensing reads the promotional calendar, so the model knows about a planned promotion before its sales come in.
What Signals Does Demand Sensing Use?
Demand sensing uses three groups of signals: internal data the company already holds, channel data from retailers and distributors, and external data such as weather and local events. Most setups combine all three:
- Internal: orders, shipments, on-hand and in-transit inventory, price changes, assortment changes and the promotion calendar.
- Channel and retailer: POS by store and SKU, retailer and distributor inventory, EDI orders and retailer campaign calendars.
- External: weather forecasts and anomalies, local events, holidays and paydays, competitor prices and promotions where you can see them, web and app traffic, search trends and social media activity.
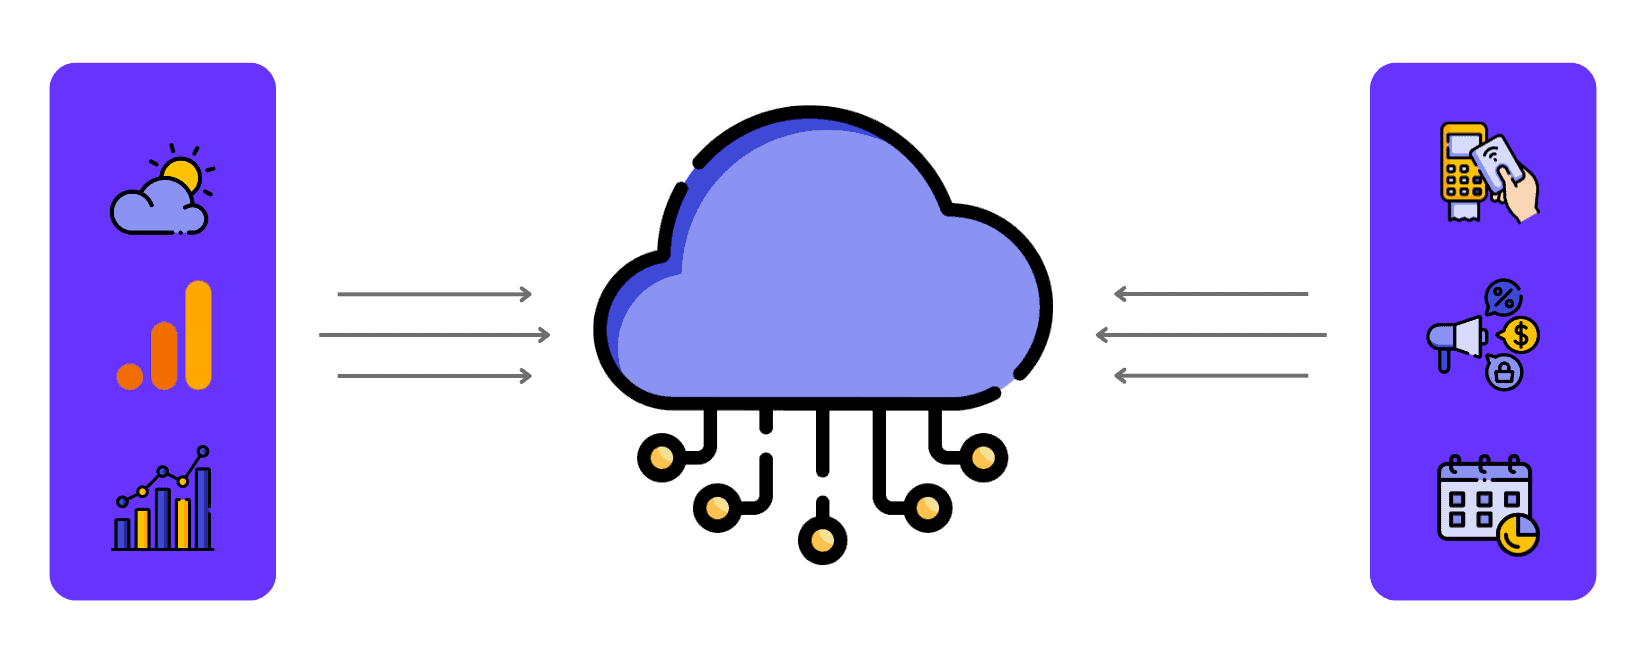
Which signals matter depends on the category. Weather drives ice cream, drinks and barbecue lines, and promotions cause the biggest swings in most packaged goods. In fresh produce, temperature and harvest timing even decide when a season starts. A model that reads every signal for every item mostly learns noise, so test each signal and keep it only where it lowers forecast error.
Two corrections come before any modeling. A stockout hides demand: an empty shelf records zero sales, and a model trained on that history learns to order less of the item that ran out. And a promotion that isn’t flagged looks like a demand spike, so the model expects the same lift again next week.
New products have no history to correct. Sensing starts them from the demand profile of similar items and shifts weight to the item’s own sales as the first weeks come in, which is often when the first reorder is decided.
The Demand Sensing Process, Step by Step
The demand sensing process has six steps, repeated daily once set up: choose the decisions and horizon, collect and clean the signals, detect real changes, update the near-term forecast, push the update into orders and plans, and measure it against the baseline.
- Choose the decisions and the horizon. Start from what the forecast will change: store orders placed two days ahead, DC deployment a week ahead, a production sequence a few weeks out. The lead time of each decision sets how far ahead sensing has to see.
- Collect and clean the signals. Load POS or sell-through, stock, open orders, prices, promotions and weather at the grain of the decision, every day. Apply the two corrections above first.
- Detect real changes. Compare what sold with what the forecast expected; software does this with pattern recognition and anomaly detection. One hot afternoon isn’t a trend; three days above forecast in every store of a region probably is. Flag only deviations large enough to change a decision.
- Update the near-term forecast. Blend the signals into the baseline, with recent data weighted heavily for the next few days and the baseline taking over further out. Machine learning models such as gradient-boosted decision trees suit this step because they handle many inputs at once and learn how signals interact, such as a price cut that lifts sales more in hot weather.
- Push the update into decisions. Recalculate orders, allocations, deployment or the production sequence within the operating constraints: lead times, pack sizes, truck and line capacity, shelf life. Inside the frozen window of a production schedule, a sensed change waits for the next window instead of reshuffling the plant.
- Measure and recalibrate. Track forecast error at the lag of each decision and check that the sensed forecast beats the baseline. Where it doesn’t, switch sensing off for that item and use the baseline. The forecast reruns daily; the model itself is usually retrained on a slower cycle, such as weekly.
Demand Sensing Solutions and Technology: What to Look For
A demand sensing solution is software that loads daily demand signals, updates the short-term forecast and passes the change to the systems that place orders and plan production. It has four parts: data integration (POS, EDI 852, ERP, promotion and weather feeds), signal modeling (features such as promotion depth, temperature against the seasonal norm and cannibalization and halo effects between items), anomaly alerts when sales leave the expected range, and links to ordering and production plans.
Questions to ask a vendor:
- Does it read POS, stock, promotions and weather at the grain you decide at, such as store-SKU-day, and within the day for fresh?
- Does it correct history for stockouts and promotions before any model learns from it?
- Does it choose a method per item and prove each one against a simple baseline before using it?
- Does the sensed forecast change orders, allocations and production plans within your constraints, without an export to another tool?
- Can planners see which signal moved a forecast? They accept a change more readily when they can.
- How does it connect to your ERP and execution systems, and how soon does it run daily on your own data?
Solvoyo is a supply chain decision automation platform. Its demand planning reads POS data, weather, web analytics, social media activity and promotional calendars continuously and adjusts the near-term plan before a deviation turns into a stockout or excess stock. For each SKU, channel and location it runs a tournament of 20+ statistical and machine learning methods, including gradient-boosted trees (LightGBM, XGBoost), deep learning models (Temporal Fusion Transformer, DeepAR) and foundation models for items with little history, and keeps the best fit after correcting history for lost sales. Every model has to beat a simple statistical baseline before it is used. Solvi, Solvoyo’s AI planning agent, monitors demand signals across SKUs, stores and channels; when a forecast deviates, it diagnoses the cause and recommends an adjustment. The forecast then feeds supply, inventory and production planning without re-entry, and the platform connects to existing ERP and execution systems without a rip-and-replace.

Demand Sensing in CPG
For a CPG manufacturer, demand sensing means forecasting from consumer demand. The orders that follow it from retailers and distributors bundle demand into batches, add the customer’s own safety stock and react to promotions days late. Sensing reads closer to the shelf: retailer POS where retailers share it (often as EDI 852 product activity data), retailer and distributor stock, open orders and the trade promotion calendar.
The decisions it changes are deployment and production. Sensed demand tells you which DC needs which product mix this week, which customer orders to commit before service slips, and how to sequence the next production run. In Solvoyo’s CPG planning, forecasts use weather signals and retailer POS data, so the plan picks up a shift in consumer demand before it shows up in shipment data.
The Magnum Ice Cream Company operates in frozen foods, where summer demand can rise fivefold. In one market’s distributor network it replenishes more than 1,000 SKUs to more than 130 distributors every day on Solvoyo, from distributor inventory snapshots and daily demand forecasts, with vehicle routing planned on the same platform. In 2024, planning time fell to a third of earlier years, and target inventory levels were consistently met without overloading the network (frozen foods case study). At a larger scale, Unilever runs demand planning on Solvoyo across 4,000+ SKUs and 40+ channels, with its daily forecasting tasks automated.
Demand Sensing Strategies for Manufacturers
Three demand sensing strategies help manufacturers use real-time data: forecast sell-through before sell-in, sense at the level you deploy, and treat promotions as known events.
- Forecast sell-through, then derive sell-in. Use POS to forecast consumer demand, then translate it into the orders each customer will place given its stock and order rules.
- Sense at the level you deploy. Customer or DC by SKU by day or week. National totals hide the regional shifts that matter for deployment.
- Treat promotions as known events. Load the trade calendar so a promoted week isn’t read as a new trend, and plan the dip that follows it.
The food and beverage supply chain guide covers how sensing fits with shelf life, seasonality and production capacity.
Demand Sensing in Retail and Grocery
For retailers, demand sensing works at store, SKU and day level, and for fresh food within the day. POS arrives within hours, promotions and price changes are known in advance, and weather moves demand store by store. The decisions are store and DC orders, the split of limited stock across stores and online fulfillment, promotional buffers and markdown timing.
İstegelsin, a Turkish rapid grocery delivery company, planned fresh produce through a crossdock serving 23 dark stores. Its forecasts were recalculated every day from the latest sales, stock positions and external signals. When a truck docked, the system pulled the current demand picture across all 23 stores and recalculated the allocation from the quantity actually received, so a truck that arrived with 480 kg instead of 500 kg didn’t break the plan. Season starts for products such as strawberries and cherries were detected from sales history, temperature models and supplier purchase orders, not last year’s calendar alone.
Within a year of go-live, fresh product availability across the crossdock scope (about a quarter of revenue) rose 14 points, from 72% to 86%, against the same period in prior years and without an increase in the waste ratio (İstegelsin case study).
Solvoyo’s grocery planning forecasts short-life categories such as produce, bakery and deli at store-day and intraday level, using weather, local events and each store’s own sales patterns. For how those forecasts become orders, see the inventory replenishment guide.
How to Measure Demand Sensing
Demand sensing is measured in two layers: the forecast first (error at the decision lag, bias and forecast value add against the baseline), then the decisions it changed (availability, lost sales, inventory, waste and the share of orders planners run without edits).
- Forecast error at the decision lag. If a store order is placed two days before delivery, judge the forecast made two days out. Weighted MAPE (WMAPE) stops slow sellers from dominating the average.
- Bias. Check whether errors lean one way. Persistent over-forecasting after sensing often means one-off peaks are being read as trends.
- Forecast value add (FVA). How much the sensed forecast lowers error compared with the baseline it replaced, item by item. Where FVA is zero or negative, sensing adds work and no accuracy.
- Business results. Availability or fill rate, lost sales, inventory days and waste, against the same period before the change.
- User acceptance rate. The share of the resulting orders and plans that planners execute without edits. Better forecasts should mean fewer manual corrections. Solvoyo builds its recommendations to be good enough that editing adds nothing, and it tracks this user acceptance rate on every decision: clients sustain over 95% across enterprise workflows, with published results from 81% in a first year to 100% in fulfillment and transportation.
As a reference point, McKinsey estimates that applying AI-driven forecasting to supply chain management can reduce forecast errors by 20 to 50 percent and cut lost sales and product unavailability by up to 65 percent. That estimate covers AI forecasting in general, not sensing alone, so set your own target from your FVA results.
Demand Sensing Benefits and Challenges
The main benefit of demand sensing is a more accurate short-term forecast at the lag of each order and production decision. That shows up as higher availability, fewer lost sales, less waste and fewer manual corrections to orders and plans. The gain is smallest for items with stable demand, where a good statistical forecast already does the job.
The challenges are mostly about data and trust. Retailer POS and distributor stock arrive in different formats and with different delays, and some customers don’t share them at all. An item that sells a few units a month gives too few data points to sense, and the baseline usually does as well. If an order or production slot is fixed eight weeks out, or sits inside a frozen window, yesterday’s sales can’t change it. And a model that reacts to every daily swing makes orders jumpy and adds error, which is what the threshold in step 3 and the baseline check in step 6 are for.
Sensing also sits between demand and supply planning, so agree who acts on an alert before the first one fires. Planners override changes they can’t explain, which cancels the gain, so show them which signal moved each forecast.
How to Build the Business Case for Demand Sensing
Build the business case on your own numbers. The pilot in the steps below produces them: run sensing beside the current forecast on one category where short-term error is expensive and measure forecast value add at the decision lag. Price that difference in lost sales, waste and inventory, then apply it to categories with the same demand pattern. The same pilot answers a planning team that calls the current tool good enough: if sensing doesn’t beat the current forecast in that category, the team is right.
For comparison, on Solvoyo’s demand planning, which includes demand sensing, forecast accuracy has improved by 420 to 2,000 basis points.
How to Start With Demand Sensing
- Pick one category where short-term error costs money. Fresh food, heavily promoted lines and weather-sensitive drinks or ice cream are good candidates, because a wrong forecast shows up as waste or empty shelves within days.
- Secure daily data: consistent POS or sell-through, stock, open orders, a promotion calendar and a weather feed. They don’t need to be perfect; they get cleaner once the process runs every day.
- Record the baseline: forecast error at the decision lag, availability, inventory and waste, before you change anything.
- Run sensing beside the current plan and compare the two at the decision lag for a few weeks before orders depend on it.
- Connect it to decisions. Let the sensed forecast drive orders or plans and have planners work the exceptions, then add categories.
To see sensed demand drive store orders or a production plan on your own data, request a demo.
About the author: Asena Yosun Denizeri is Senior Vice President, Head of Solutions at Solvoyo. She has spent over 30 years implementing planning, pricing and optimization solutions for global retailers across the U.S. and Europe.
Demand Sensing FAQ
Sensed demand updates the short-term forecast, and the update changes the plans built on it: store and DC replenishment, allocation, deployment and the production sequence. For a CPG manufacturer, retailer POS, inventory levels, EDI orders and trade promotion calendars show which product mix to send to priority DCs and which order commitments to adjust before service slips. Inside a production schedule’s frozen window, changes wait for the next window. On Solvoyo, the sensed forecast feeds supply, inventory and production planning on one platform without re-entry.
Yes, when the sensed forecast feeds load and route planning directly, so trucks are planned against expected demand instead of last week’s orders. If transport is planned in a separate system from the order file, the transport plan only sees a change once the orders arrive, so look for a tool that plans replenishment and transport together. In one market, The Magnum Ice Cream Company replenishes more than 1,000 SKUs to more than 130 distributors every day on Solvoyo, from distributor inventory snapshots and daily demand forecasts, with vehicle routing planned on the same platform (frozen foods case study).
Yes. External signals include weather forecasts and anomalies, local events, holidays, web and app traffic, search trends and social media activity. Macroeconomic indicators such as inflation or consumer confidence move slowly, so they matter more to the longer-range demand plan than to a forecast for the next few days. Models usually turn them into features, such as the gap between forecast temperature and the seasonal norm. Solvoyo reads weather and other external drivers alongside internal history and feeds the result into replenishment planning.
A demand sensing model combines internal, channel and external signals. Internal signals are orders, shipments, on-hand and in-transit stock, prices, assortment and the promotion calendar. Channel signals are POS by store and SKU, retailer and distributor stock, and campaign calendars. External signals include weather, local events, web traffic and search trends. Before use, history is corrected for stockouts and promotions are flagged.
No. Retailers use it for store and DC orders, and manufacturers use it too. A CPG manufacturer that senses retailer POS and distributor stock sees demand changes before they reach its own order book, which steadies production and deployment. Distributors and wholesalers can do the same with their customers’ order and stock data where they receive it. It also applies in fashion, pharmaceuticals and consumer electronics, wherever lead times are short enough for a recent signal to change an order.
A beverage brand senses sell-through from retailer POS where retailers share it, loads the trade promotion calendar so a promoted week isn’t read as a new trend, and adds a weather feed, because its demand moves with temperature and promotions, often within days. The sensed forecast then sets what each distributor or DC needs this week and the sequence of the next production runs, before orders show the change. In Solvoyo’s CPG planning, forecasts use weather signals, retailer POS data and promotional calendars, so the plan picks up a shift in consumer demand before it appears in shipment data. The beverage planning article covers seasonality, distributor replenishment and truck routing.
Building the forecasting model is the smaller part of the work. A demand sensing tool also needs daily feeds from POS, EDI and ERP systems, stockout and promotion correction, a method chosen per item and tested against a baseline, monitoring that switches sensing off where it doesn’t help, and write-back into orders and production plans within their constraints, all running every day. An in-house build makes sense when a team can staff all of that permanently. A platform brings those parts ready-made, so the project becomes configuring them to your decisions and data instead of building and running them. An in-house team has to build and run every one of those parts before the first sensed forecast changes an order. On Solvoyo, a project typically goes live within 12 weeks of contract, with planners approving each recommendation at first, and shows measurable results in the first three to four months (implementation timeline).
It depends on what short-term forecast error costs you. For fresh food, heavily promoted lines and weather-sensitive items, a wrong forecast shows up as waste or empty shelves within days, and that is where sensing is most likely to pay off. For items with stable demand, a regular statistical forecast is enough. Retailers and manufacturers can settle it with a test: run sensing beside the current forecast on one category and compare forecast error at the decision lag.
You need consistent daily POS or sell-through data, a reliable promotion calendar, basic out-of-stock correction and a weather feed for weather-sensitive items. Perfect master data isn’t a precondition, and neither is replacing your ERP: Solvoyo connects to existing ERP and execution systems, and its data diagnostics flag gaps and fill missing data points inside the platform. Data quality improves once the process runs every day, because errors show up as forecast misses that someone has to explain.
No. It takes over the routine adjustment of short-term forecasts and flags the exceptions that need a planner’s judgment. Planners still own promotions, new products, supply problems and anything the signals can’t see, such as a competitor’s store opening next week. A good measure of trust is how many of the resulting orders planners accept without edits.
Demand sensing lowers short-term forecast error, which shows up as higher availability, fewer lost sales and less waste. McKinsey estimates that AI-driven forecasting in general, not demand sensing alone, can cut supply chain forecast errors by 20 to 50 percent. On Solvoyo, İstegelsin’s fresh availability rose from 72% to 86% within a year with no rise in its waste ratio, and The Magnum Ice Cream Company cut planning time to a third. Sensing adds little for items with stable demand.