
Supply chain disruption planning is the work of deciding, before anything goes wrong, which events you will prepare for, how much buffer and backup capacity each one justifies, and what signal switches the business onto the backup plan. It covers weather and climate events, supplier outages and sudden demand shocks. When the plan exists in advance, planners respond to a disruption by running a prepared scenario.
What Disruption Planning Covers
Supply chain disruption planning covers three kinds of event:
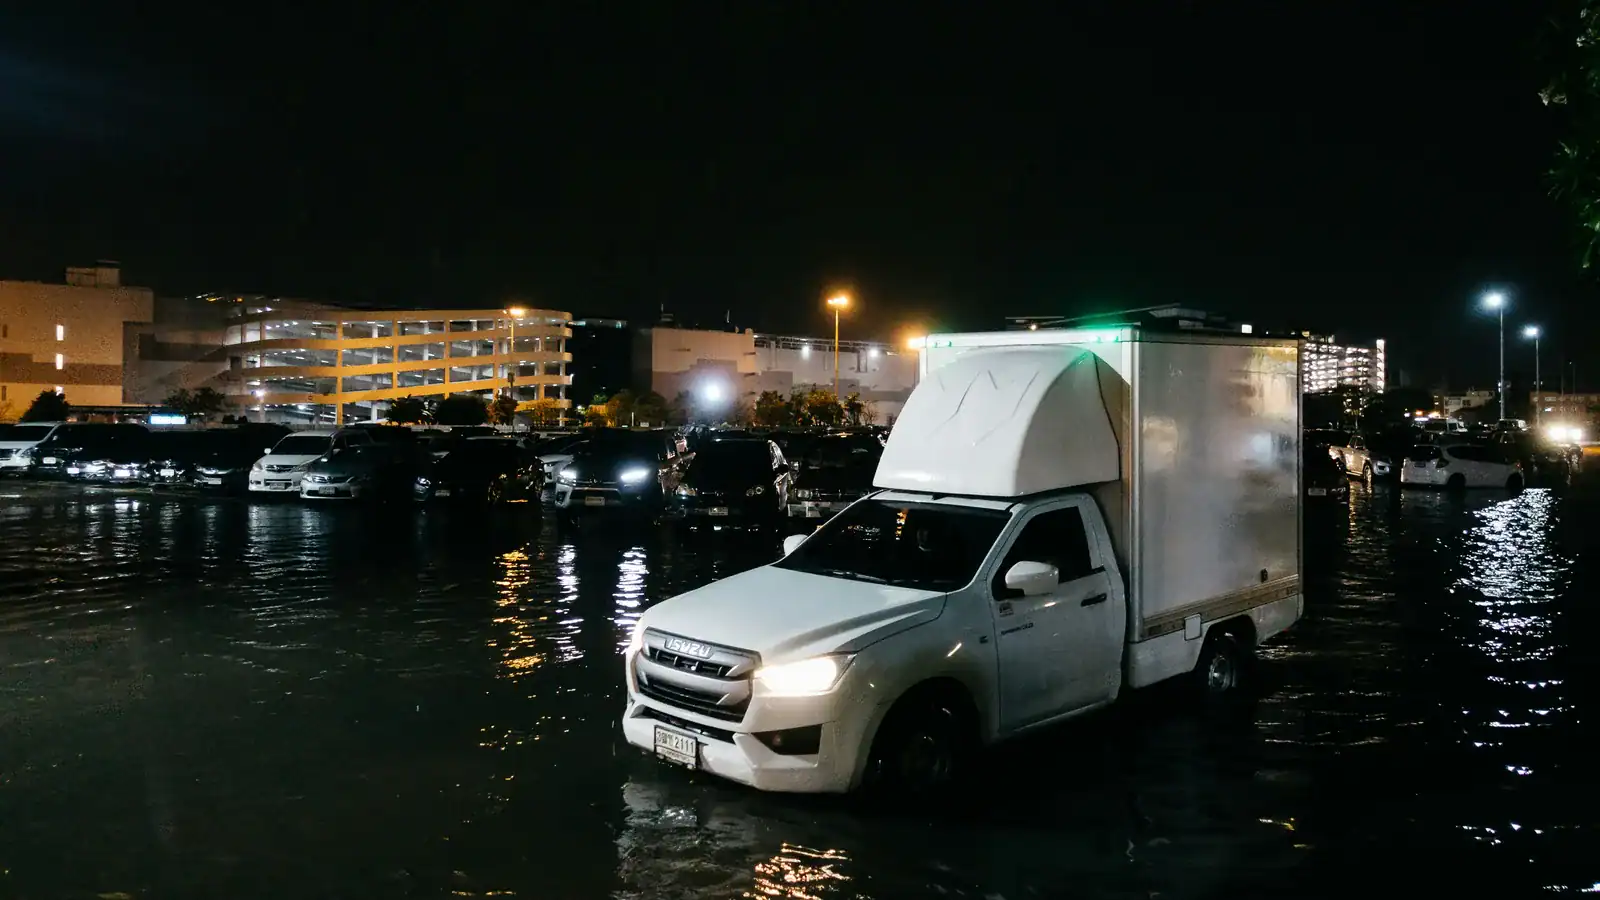
- Weather and climate events: floods, storms, heatwaves and cold snaps that close roads, ports or plants and, at the same time, move demand for weather-sensitive products such as ice cream, beverages, seasonal clothing and garden goods.
- Supplier outages: a plant fire, a quality hold, a supplier’s insolvency, a strike or port congestion that cuts or delays supply of one or more items.
- Demand shocks: panic buying, lockdowns, a product that goes viral, or a competitor’s stock-out that sends its customers to you.
Weather shows why averages are a poor basis for these plans. According to NOAA’s Climate.gov, Texas had its wettest month on record in May 2015, and the rain largely ended a drought that had held the Southern Plains since 2011. A water plan built for the average year fitted neither the drought nor the flood. Supply chains face the same swing: a plan built on last year’s average or last summer’s peak can be wrong in both directions within one season.
Identify and Rank the Risks
Start by walking each node and lane of the network and noting where a single failure would stop supply:
- Items with a single source, or a single qualified plant.
- Lanes with long lead times, where a delay cannot be recovered before stock runs out.
- Capacity bottlenecks: one production line, one DC or one port that carries a large share of volume.
- Sites and lanes exposed to weather, such as flood plains, mountain passes and ports in storm seasons.
- Items whose demand moves sharply with weather, events or news.
For each exposed node, estimate how long it would take to restore full function after a disruption. In a 2014 Harvard Business Review article, researchers David Simchi-Levi, William Schmidt and Yehua Wei call this time to recovery (TTR) and use it to rank supplier and site risk. Compare TTR with how long your current stock and alternatives would keep you serving customers. Where recovery takes longer than your cover, the node needs a plan. Rank those nodes by the margin or sales at risk during the gap.
Which Buffers and Backups Are Worth Their Cost?
Every mitigation has a running cost, and its value depends on how often it is used. Extra safety stock ties up working capital every day. A qualified second supplier costs audits, minimum volumes and often a higher unit price. Reserved capacity at a third-party warehouse or carrier is paid for whether or not it is used.
Compare the expected loss avoided with the cost of carrying the protection. A simple example: if a supplier outage has a 10% chance of happening in a year and would cost 2 million in lost margin, the expected loss is 200,000 a year. A backup supplier that costs 80,000 a year to keep qualified and cuts the loss by three quarters is worth keeping. One that costs 300,000 is not, and a smaller buffer of the affected items may do the job for less. The same check applies to large one-off investments: a measure that protects against an event expected once a decade has to pay for itself over that decade.
The options, roughly from cheapest to carry to most expensive:
- Safety stock sized for the item’s real forecast error and lead time variability, held where it covers the most demand.
- Strategic pre-builds of critical items before a known risk window, such as a hurricane season or a supplier’s plant shutdown.
- Alternate lanes, ports or DCs that are already modeled and priced, so switching to them needs no new negotiation.
- Qualified second sources for single-source items with long TTR.
Build Scenarios Before You Need Them
A scenario is a stored version of the plan under a defined event: supplier A down for six weeks, a regional DC closed for five days, demand for a category 40% above forecast for three weeks, a heatwave in one region. For each one, the plan records the response: which customers or stores get priority for scarce stock, which items are substituted, which alternate source and lane are used, and which orders are expedited.
Running these scenarios ahead of time shows where the gaps are. If the six-week supplier outage leaves a top item out of stock in week four even with every backup in use, that is the item to buffer or second-source now. Network-level questions, such as whether to add a DC or move a sourcing region, belong to strategic network design and scenario planning. Forecasts expressed as ranges rather than single numbers help size the demand scenarios; our post on probabilistic demand planning covers that method.
Predictable peaks are not disruptions. Summer demand, holidays and back-to-school belong in seasonal demand planning; disruption scenarios cover the deviations from that plan.
Trigger Points in Supply Chain Disruption Planning
Trigger points tie each scenario to a measurable signal, a threshold, an owner and a pre-approved first action. Typical triggers:
- Supplier on-time-in-full falls below an agreed level for two consecutive weeks, or a confirmed ship date slips by more than a set number of days.
- A weather forecast for a region or lane passes a threshold, for example rainfall, wind speed or temperature days ahead of the event. Weather also moves demand, which our post on weather-influenced demand forecasting discusses.
- Sales run above or below forecast by more than a set margin for several days in a row, across many stores or customers at once.
- Port dwell times or carrier transit times rise above their normal range.
Set thresholds so that the first action is cheap and reversible, such as raising an order or reserving capacity, and the expensive actions, such as switching suppliers, come at a later trigger. Write down who decides, so nobody has to look for an approver in the first hours of a disruption.
Re-Plan Fast When the Disruption Hits
Once a trigger fires, the plan has to be rebuilt with the new constraints: reduced supply, a closed lane, a demand spike. The rebuilt plan reallocates scarce stock by priority, reschedules production, reroutes shipments and tells suppliers what has changed. A weekly planning cycle is too slow for this; the plan needs to re-run daily, or as soon as the change is known.
A101, a grocery retailer with more than 12,000 stores, faced this during COVID-19. According to the A101 case study, the company’s sales rose more than 50% from April to May while out-of-stocks rose only 3%, mainly from supplier issues. Its managing director credits a diagnostic dashboard and Solvoyo’s daily replenishment recommendations for that agility.
After each event, compare what happened with the scenario: real TTR, real demand change and whether the triggers fired in time. Update the scenarios and thresholds with what you learned.
How Solvoyo Supports Disruption Planning
In Solvoyo’s S&OP solution, teams build and compare scenarios side by side, including supplier risk contingency plans and volume upside and downside cases, then authorize the chosen one straight into supply and inventory planning. Inventory planning sizes safety stock from actual forecast error, lead time variability and supply uncertainty. Predictive alerts flag demand shifts, supply risks and service-level threats before they hit, and a change in a forecast or a parameter triggers a re-run of the plan without a planner starting it.
Because the contingency is modeled before the event, the plan issued when a trigger fires already respects the new supply and lane limits, so nobody rebuilds it under pressure. Over 95% of Solvoyo’s plans execute untouched. To test your own disruption scenarios, request a demo.

Frequently Asked Questions
Supply chain disruption planning means preparing in advance for events that cut supply or shift demand, such as floods, supplier outages and demand shocks. It identifies the exposed nodes, weighs the cost of buffers and backups against the loss they avoid, stores a response scenario for each event, and sets trigger points that tell the team when to switch to it.
Map the sites and lanes exposed to floods, storms or extreme temperatures, and the products whose demand moves with weather. Pre-position or pre-build critical stock before known risk seasons, model alternate lanes and DCs in advance, and use weather forecasts as trigger points for both supply actions and demand adjustments.
A trigger point is a measurable signal and threshold that switches the plan to a prepared scenario, such as supplier on-time-in-full falling below a set level, a confirmed ship date slipping by more than a set number of days, or a severe weather forecast for a lane. Each trigger has an owner and a pre-approved first action.