
The study from the ARC Advisory Group (2016) and the most recent one from The Hackett Group (2018) are remarkably similar in their basic observations: “supply chain visibility & analytics” remains at the top-of-mind for the executives. Many large corporations want “supply chain control towers” to measure forecast accuracy across products and regions, understand regional differences in demand patterns, analyze returns, balance demand, and supply, track supply chain performance and gain insights to manage their product portfolio. Some control towers request near-real-time analysis, drill down capabilities, simulation and predictive analytics.
Honestly, while many in the digital media talk about comprehensive supply chain visibility and analytics initiatives, I see very few success stories on supply chain visibility and analytics with these idealized “control tower” characteristics. It may be because of the reported statistic that over half of the large IT projects fail, and a large portion of the completed projects do not survive user scrutiny. To a large degree, Excel remains the focus of data consolidation, visibility, and analytics.
Before diving into key requirements of successful supply chain visibility and analytics, first, make a quick definition of these two points.
What is supply chain visibility?
Supply chain visibility is the ability of monitoring or displaying of product orders and physical product shipments from the production phase to their distribution and ultimately to their latest delivery point.
The objective of supply chain visibility is to boost the performance and democratize the supply chain by making information easily usable to each participant of the process and every stakeholder, including customers. The application of supply chain visibility tools or software let various supply chain units in a company to gather instant and the most accurate information.
What is supply chain analytics?
Supply chain analytics at its core definition is about converting entire data and incoming current supply chain information into applicable insights for making optimal planning decisions for the purpose of improving the supply chain efficiency.
For better planning, supply chain analytics mainly include the mix of applications of mathematics, predictive modeling, and machine-learning techniques. It contains complete analytics capabilities: sourcing, distribution, manufacturing, and logistics.
So, enhancing the awareness of supply chain analytics can also improve the predicting accuracy along with increasing product life cycles and fluctuating customer demands with data-driven decisions.
4 Keys to a Successful Supply Chain Visibility and Analytics Project
Having completed a sizeable global project (180+ countries, 6 regions, and HQ) on supply chain visibility and analytics, I wanted to share a few insights.
First, the context:
- The relevant area of focus on this supply chain visibility and analytics project is decision support across a global supply chain, and not the digital means of creating data for Excel reports or sharing data across enterprises or tracing your shipments from China.
- The project goals are specific: automation, simplification, visualization, and insights
- The expected value of the project is clear and measurable:
- Actionable insights through analytics
- The ability to identify cross-region discrepancies rapidly
- The ability to unpack data from a global level down to a transaction in seconds
- Increased accuracy and efficiency due to an Excel-less environment
- Process durability and institutional memory across regions
If you want to be successful in a project with similar goals and value potential, then do the following:
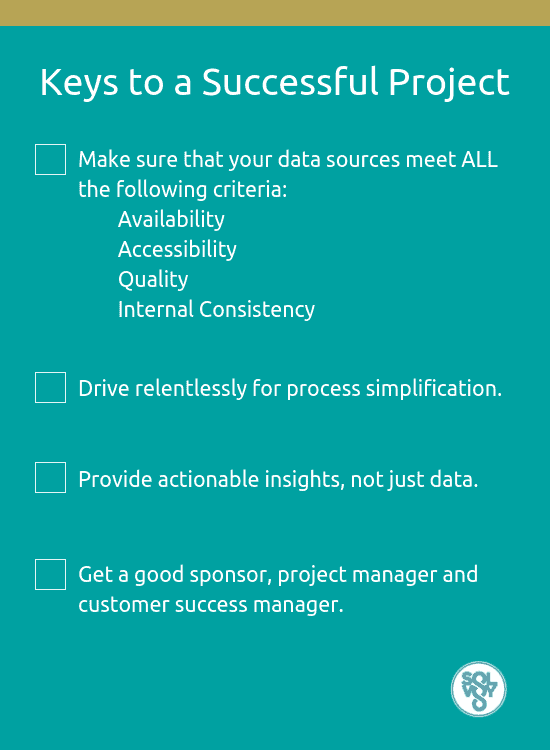
1. Make sure that your data sources meet ALL the following criteria:
- Availability
- Accessibility
- Quality
- Internal Consistency
The “big data” may be available in many systems of record (ERP, CRM, PLM, WMS, TMS, plus your favorite three-letter acronyms here), or in Excel sheets, or in someone’s mind. You need to be able to access those structured and unstructured data through automation. This may call for new efficient and secure data integration methods to complement (or perhaps replace) the traditional technology that only served your within-enterprise reporting needs.
After accessing the available data, you need to relate the data from different sources and measure its quality, and always remember that garbage-in-garbage-out applies to insights and decisions supported by “big” data. The data quality increases by use, not by the mere fact that you have stored the data somewhere.
Last but not the least, you need to ensure that everyone involved uses the same high-quality data consistently. The average global company has 7 different ERP instances (each of which may consist of different configuration and/or technology) and half report low confidence that internal or external IT resources can close the visibility gap (Supply Chain Insights, 2014). The alternatives should include cloud-native best-of-breed technologies with ERP-agnostic data architectures with broad data models for both structured and unstructured data and integration technologies that get implemented in weeks.
2. Drive relentlessly for process simplification and user productivity:
In short, you need one federated constitution to underpin the regional-global governance model. I can confidently say that process alignment among the regions is by far the most significant challenge in a global project. Global companies differ from international companies in the consistency of their management processes in different parts of the world. Yes, companies need to customize their products and services to fit the needs of their market. Yes, the local culture plays a role in marketing and sales. Yes, you may need to localize the UI language of your tools, or pay for and track your cost in local currency. However, (I say) the global companies need to maintain a few common principles for supply chain visibility and planning analytics, i.e., demand planning, supply planning, inventory planning, order fulfillment, transportation, logistics management, and KPI measurement:
- Build and document common assumptions on what “demand” or “supply” or “inventory” constitutes. Distinguish between dependent and independent demand, clarify internal/external supply, segregate inventory in terms of its location and status, etc.
- Define, measure and report consistent KPIs – consistent in calculation and assumptions. Specify and document measures such as forecast accuracy, inventory turns, lead-time, OTIF%, etc.
- Enhance user experience by customizable UI and reporting. If you are currently complaining about unused ERP reports or an Excel-hell and need to reduce your dependence on IT, then give your users something that matches the Excel experience in flexibility and speed
- Update your master data at the speed of business to support your plans and reports. Make sure that your units of measure, product hierarchies, life-cycle data, attributes, etc. are current and remain current to support your supply chain visibility and analytics horizon
To increase your chances of success, involve the regional teams in your process early and often. Listen to them to learn how they use digital tools. Remember that the millennials are planning your business right now and that all they grew up with better and faster technology –a clue to designing durable processes and UIs. The cultural differences across the globe in the digital age are getting smaller and this is good news for global projects, but you need to understand the motivational dynamics of this generation.
3. Provide actionable insights, not just data:
The promise of immediate enlightenment followed by an action… Sounds cool, right? Forrester (2016) reports that “74% of firms say they want to be data-driven, [while] only 29% say they are good at connecting analytics to action.”
The myth is that, if the data are visible through reports, then one can certainly take the right action.
Not really!
What truly enables a seamless transition from data to correct action is the insight. While Greek generals relied on Tiresias -the blind prophet of the underworld- for insight, we now have analytics.
Here is a list of must-haves in each supply chain visibility project:
- KPIs measuring target vs plan vs actual data
- Configurable reports showing you data in different data resolutions
- Drill-down capability to trace any aggregate number to its transaction data
The above may provide insights given time, but will not be nearly sufficient for the correct action! Let’s say that you manage over 16,000 unique SKUs across 180+ countries. Regardless of the number of reports available to you (or sometimes because of it), it will be difficult to allocate sufficient quality time to analyze all SKUs, develop the appropriate insights and take the correct action. Insights for business action should be visible in the form of an exception list and the estimated consequences of each action. For example, you should not only see an excess stock list but also a prioritized set of stock reduction actions you can feasibly take right now and the corresponding consequences on budget or gross-margin, including the consequence of no action. You should be able to see alerts on actual or potential out-of-stock situations, prioritized by customer and channel, along with the possible actions you can take, e.g., expedite purchasing/manufacturing, move the due dates, shift existing inventory from another customer, substitute a higher value product, etc.
4. Get a good sponsor, project manager, and customer success manager
This may be an obvious key observation, even cliché, but that does not reduce its importance.
Nowadays, visibility projects involve a lot of new technology and usually require significant IT involvement. However, supply chain visibility projects cannot be left to the IT department to “get it done.” IBM reports that Project Management is the most important contributor (at 54%) to an IT project failure, more than all other measured factors combined! A competent project manager (PM), as well as an effective sponsor, are the primary keys to a project’s success, perhaps more significant for a global project with several stakeholders. So, choose a success-driven PM who understands his/her own critical role and can communicate up, down and sideways with equal ease. In a global project, the PM should be willing and able to work with different cultures in different time zones.
The sponsor -whether from the IT department or the business- should also be able to communicate with his executive colleagues -each with his/her own agenda- the project and its common goals, help remove barriers during the project and share the accountability of a project’s success with all. Weak sponsorship kills a major project when management changes or milestones slip or roadblocks emerge or individual agendas take over, often resulting in loss of control and gradual failure.
Last but not the least, you must ensure that, once the project is completed, it has sufficient support to live happily ever after. Take into heart what my sponsor told me after we delivered the project: “We will celebrate for real when this visibility and analytics platform is still in use one year from now.” For a SaaS company like Solvoyo, that job belongs to a Customer Success Manager who will ensure that the visibility and analytics platform retains its relevance under changing business requirements, maintains the data interfaces, is usable by all stakeholders and creates measurable value. For an internal project, you should identify and appoint someone (not a team, but a single name) with a similar mission.
In closing, there are many factors that will enable success in a global supply chain visibility project. I have shared four key factors. Let me know of your feedback, including wild disagreements.